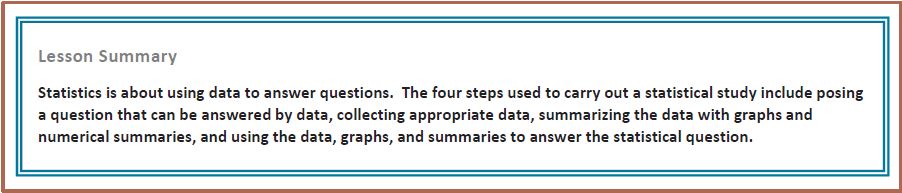
Topic A: Understanding Distributions
Statistical and non statistical questions:
Practice:
http://www.khanacademy.org/math/cc-sixth-grade-math/cc-6th-data-statistics/cc-6th-statistics/e/statistical-questions
http://www.khanacademy.org/math/cc-sixth-grade-math/cc-6th-data-statistics/cc-6th-bar-charts/e/reading_bar_charts_1
http://www.khanacademy.org/math/cc-sixth-grade-math/cc-6th-data-statistics/cc-6th-bar-charts/e/creating_bar_charts_1
http://www.khanacademy.org/math/cc-sixth-grade-math/cc-6th-data-statistics/cc-6th-bar-charts/e/reading_bar_charts_2
http://www.khanacademy.org/math/cc-sixth-grade-math/cc-6th-data-statistics/cc-6th-bar-charts/e/reading_bar_charts_3
R.11 Create histograms R.6 Create frequency tables
Topic B: Summarizing a Distribution that is Approximately Symmetric Using the Mean and Mean Absolute Deviation
Exploring mean and median module: Ben Eater and Sal work through the mean and median module: http://www.khanacademy.org/math/statistics/e/exploring_mean_and_median
Practice:
http://www.khanacademy.org/math/cc-sixth-grade-math/cc-6th-data-statistics/cc-6th-statistics/e/mean_median_and_mode
http://www.khanacademy.org/math/cc-sixth-grade-math/cc-6th-data-statistics/cc-6th-statistics/e/the-mean
Practice:
http://www.khanacademy.org/math/cc-sixth-grade-math/cc-6th-data-statistics/cc-6th-statistics/e/mean_median_and_mode
http://www.khanacademy.org/math/cc-sixth-grade-math/cc-6th-data-statistics/cc-6th-statistics/e/the-mean
S.2 Interpret charts to find mean, median, mode, and range
S.3 Mean, median, mode, and range: find the missing number
S.3 Mean, median, mode, and range: find the missing number
S.4 Identify representative, random, and biased samples
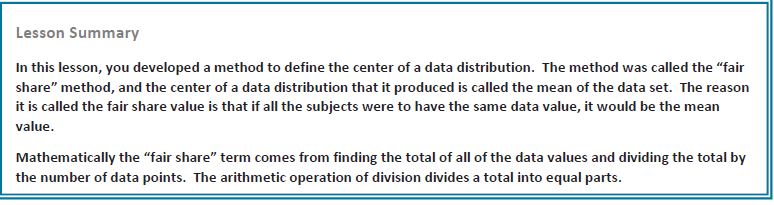
Lesson 6-'Fair Share'
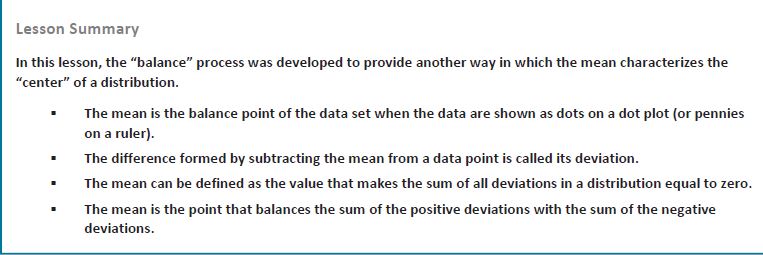
Lesson 7: The Mean as a Balance Point
Lesson 8: Variability in a Data Distribution
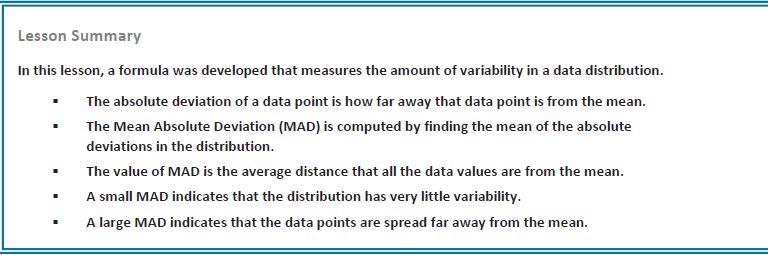
Lesson 9: The Mean Absolute Deviation (MAD)
Lesson 10: Describing Distributions Using the Mean and MAD
Lesson 11: Describing Distributions Using the Mean and MAD
Topic C: Summarizing a Distribution that is Skewed Using the Median and the Interquartile Range
Practice:
http://www.khanacademy.org/math/cc-sixth-grade-math/cc-6th-data-statistics/cc-6th-box-whisker-plots/e/creating_box_and_whisker_plots
http://www.khanacademy.org/math/cc-sixth-grade-math/cc-6th-data-statistics/cc-6th-box-whisker-plots/e/analyzing-data-with-box-plots
R.17 Interpret box-and-whisker plots
S.1 Calculate mean, median, mode, and range
S.2 Interpret charts to find mean, median, mode, and range
Lesson 12: Describing the Center of a Distribution Using the Median
Lesson 13: Describing Variability Using the Interquartile Range (IQR)
Lesson 14: Summarizing a Distribution Using a Box Plot
Lesson 15: More Practice with Box Plots
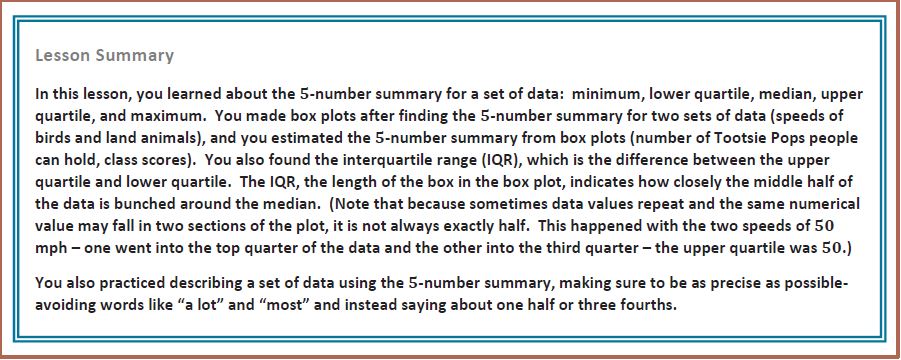
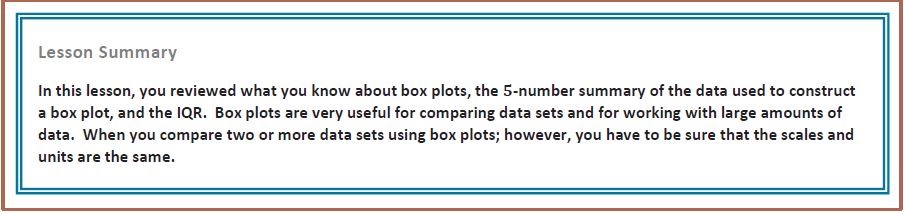
Lesson 16: Understanding Box Plots
Lesson 6-'Fair Share'
Lesson 7: The Mean as a Balance Point
Lesson 8: Variability in a Data Distribution
Lesson 9: The Mean Absolute Deviation (MAD)
Lesson 10: Describing Distributions Using the Mean and MAD
Lesson 11: Describing Distributions Using the Mean and MAD
Topic C: Summarizing a Distribution that is Skewed Using the Median and the Interquartile Range
Practice:
http://www.khanacademy.org/math/cc-sixth-grade-math/cc-6th-data-statistics/cc-6th-box-whisker-plots/e/creating_box_and_whisker_plots
http://www.khanacademy.org/math/cc-sixth-grade-math/cc-6th-data-statistics/cc-6th-box-whisker-plots/e/analyzing-data-with-box-plots
R.17 Interpret box-and-whisker plots
S.1 Calculate mean, median, mode, and range
S.2 Interpret charts to find mean, median, mode, and range
Lesson 12: Describing the Center of a Distribution Using the Median
Lesson 13: Describing Variability Using the Interquartile Range (IQR)
Lesson 14: Summarizing a Distribution Using a Box Plot
Lesson 15: More Practice with Box Plots
Lesson 16: Understanding Box Plots
Topic D: Summarizing and Describing Distributions
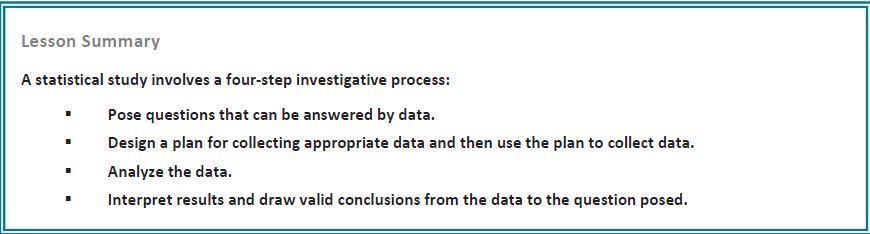
Lesson 17: Developing a Statistical Project
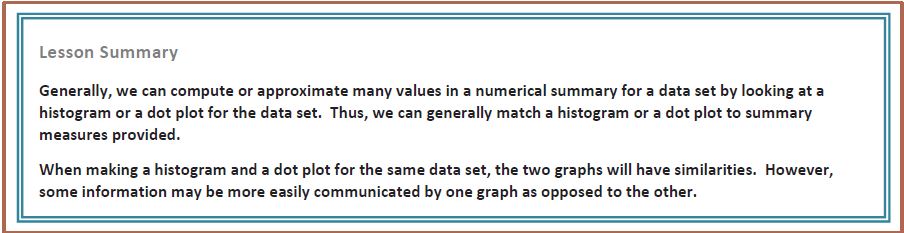
Lesson 18: Connecting Graphical Representations and Numerical Summaries
Lesson 19: Comparing Data Distributions
Lesson 20: Describing Center, Variablitiy, and a Shape of a Data Distribution from a Graphical Representation
Lesson 21: Summarizing a Data Distribution by Describing Center, Variability, and Shape
Lesson 22: Presenting a Summary of a Statistical Project